
 Print This Post
 Tau’s villain arc in Alzheimer’s—from soluble protein to tangle—is marked by a succession of post-translational modifications (PTMs). At this year’s Alzheimer’s Association International Conference, held July 12–15 in London, Axelle Vanparys, working with Bernard Hanseeuw and Pascal Kienlen-Campard at the University of Louvain in Brussels, updated the story of where and when tau acquires which PTMs over the course of the disease. Unlike previous studies, this work also charts modifications to soluble tau—the species most readily detected in cerebrospinal fluid (CSF) and blood—and identifies which PTMs track most closely with tangle burden.
The best-known tau PTMs are phosphorylations at its serine and threonine residues, namely S202/T205, T212/S214, T231, and S396/S404, which, for more than 30 years, have served as markers of tangle pathology in Alzheimer’s brains. More recently, immunoassays that can detect tau phosphorylated at T181 and T217 in CSF and blood have given clinicians a way to identify early pathological changes before memory and thinking begin to lapse (Jul 2020 news; Jul 2026 conference news). Researchers are also investigating whether these biomarkers, alongside others, can determine a person’s stage of AD (May 2026 news).
But besides phosphorylation, tau also picks up a variety of other PTMs, including acetylation, ubiquitination, and methylation. In 2020, researchers led by Judith Steen at Boston Children’s Hospital published the first comprehensive map of tau PTMs in AD (Dec 2020 news). Using mass spectrometry, they analyzed insoluble fractions of postmortem cortical tissue from 49 cases and 42 controls. Altogether, they identified 95 distinct PTMs at 88 amino acid residues.
Using hierarchical clustering, Steen and colleagues found that the samples fell into four distinct groups based on their combinations of tau PTMs (Dec 2020 news). The first consisted predominantly of asymptomatic controls with Braak stages 0–III, whose tau carried only a smattering of phosphorylations in the proline-rich region. The second included cases with advanced Braak stage tauopathy as well as controls, with tau bearing a broader array of phosphorylations extending into the C-terminal region. Within this second group, a subset also had ubiquitination within the microtubule-binding region (MTBR), and all of them had died with dementia. The remaining two groups comprised people with Braak stage V or VI pathology and dementia; their tau carried extensive phosphorylation, MTBR ubiquitination, acetylation.
In London, Vanparys presented her work mapping the PTMs that glom onto both soluble and insoluble tau in people with different stages of Alzheimer’s pathology. To do so, she used mass spectrometry to analyze brain fractions from the hippocampi, inferior temporal gyri, and inferior frontal gyri of 16 brain donors. These regions become progressively affected as tangles spread through the brain. Cases were classified according to the ABC neuropathological staging system, which integrates Thal amyloid phase, Braak neurofibrillary stage, and the CERAD neuritic plaque score. Five donors, who were around 90, none of whom had been diagnosed with AD, were classified as having low pathology. Seven, average age 93, had intermediate pathology; three had an Alzheimer’s diagnosis. The remaining four, mean age 72, had high pathology, and all had been diagnosed with AD.
In the insoluble fractions of these brains, Vanparys identified 48 individual tau PTMs, 41 of which differed between pathological stages. Between those with low and intermediate pathology, phosphorylation at T212, S214, T217, S235, S237, S238, S262, S400, T404, and S416 ramped up in at least one brain region; so did acetylation at K311 and K369, and ubiquitination at K267, K311, and K317. From intermediate to high pathology, tau got hit with a second wave of modifications, including phosphorylation at S113, T181, S184, S185, S191, S199, S202, T205, S356, S409, S412, and S413; acetylation at K317, K353, K375, and K385; and ubiquitination at K234, K240, K254, K274, and K281. On the flip side, phosphorylation at S305 and T386, acetylation at K343, and ubiquitination at K385 declined with advancing Alzheimer’s pathology. Though there were some differences in individual sites, the sequence largely mirrored the one originally proposed by Steen and colleagues, in which phosphorylation preceded acetylation and ubiquitination.
In the soluble fraction, after immunoprecipitating tau, Vanparys identified 42 individual tau PTMs, only 22 of which varied from one pathological stage to another. As in the insoluble fraction, the biggest changes were in phosphorylation. From low to intermediate pathology, phosphorylation at T181, S202, T217, S235, S262, and S396 increased. From intermediate to high pathology, still more phosphorylations piled on at T153, S199, T212, T231, S237, S238, S400, S412, S416, and S422, while phosphorylation at S46 and S214 waned. Ubiquitination increased at just one site, K311.
No changes in acetylation were detected on soluble tau, but methylation entered the picture. Methylation at K150, K258, and K267 dwindled as pathology advanced. These data, along with the full map showing where these changes occur in the tau protein (see below), were posted to bioRxiv on April 10.
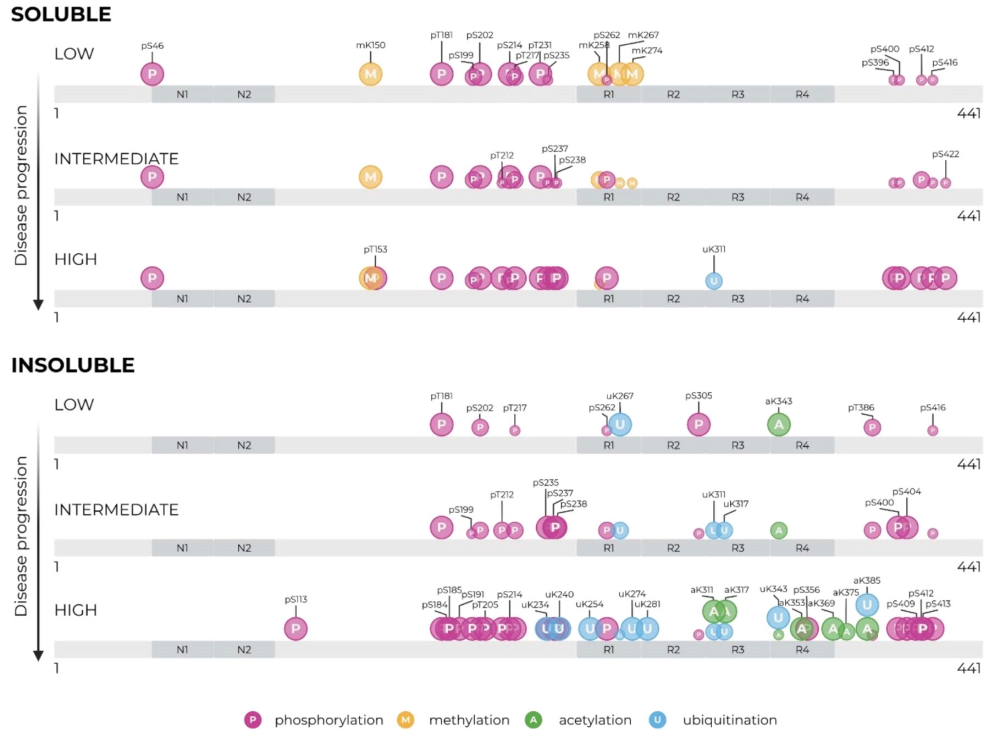
Modifications Map. Phosphorylation (pink) increased during both early and late stages on soluble and insoluble tau. In later stages, acetylation (green) and ubiquitination (blue) accumulated on insoluble tau, while methylation (yellow) on soluble tau gradually vanished. Larger circles indicate increases; smaller circles, decreases. [Courtesy of Vanparys et al., 2026.]
Scientists are particularly interested in PTMs on soluble tau because these modifications can be detected in biofluids. To see if any soluble tau PTMs could serve as potential biomarkers, Vanparys correlated each with the total amount of tau in the insoluble fraction. Sure enough, all four methylation sites were inversely correlated with insoluble tau levels, whereas numerous phosphorylation sites were positively correlated. Among them, pS262 tracked insoluble tau most reliably, performing slightly better than the more established biomarkers pT181 and pT217 (image below).
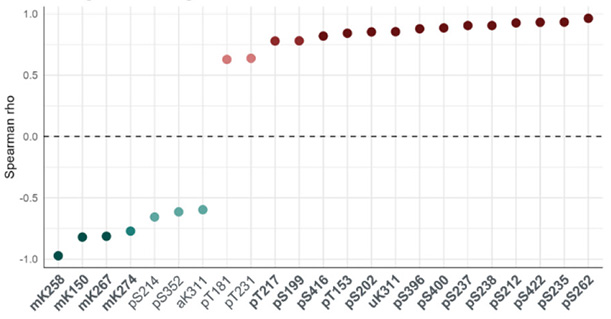
PTMs and Aggregation? Correlations between individual soluble tau PTMs and insoluble tau burden. PTMs associated with higher levels of insoluble tau are shown on the right, while those associated with lower levels of insoluble tau are shown on the left. [Courtesy of Vanparys et al., 2026).
In Belgium, the team is now analyzing CSF samples from these 16 individuals to see whether their PTMs track disease pathology, Vanparys and Kienlen-Campard told Alzforum. Curiously, unlike p-tau217, pS262, which lies within the microtubule-binding region, was recently reported to decrease in the CSF of people with Alzheimer’s disease who have rapid cognitive decline (Apr 2026 news).—George Heaton


 Dementia Researcher



 Professor Louise Serpell